For restaurants
The back office a chain would give you.
Independent kitchens run on the same three numbers the groups do, prime cost, plate margin and cash. The difference has never been the maths. It has been who could afford somebody to do it.
- 60%
- prime cost ceiling for a healthy full-service kitchen
- 28–35%
- the food cost band most menus should sit inside
- 4
- classes every plate falls into, on your own sales mix
- 13
- weeks of cash visibility, updated as you trade
Prime cost
Food plus labour, watched weekly.
Prime cost is the single most-watched number in the industry: cost of goods plus labour, as a share of sales. Above 60% in a full-service kitchen and the business is usually working for its suppliers and its rota.
Recipe costing
Every plate, to the gram.
Enter ingredients once with their unit costs, then build each dish from them. Change the price of chicken and every dish containing chicken re-costs itself.
- True plate cost, food-cost percentage and cash margin per dish
- The price that would hit your target food cost, calculated for you
- Par levels with low-stock warnings before you run out mid-service
- Monthly profit per item, so you know what actually pays the rent
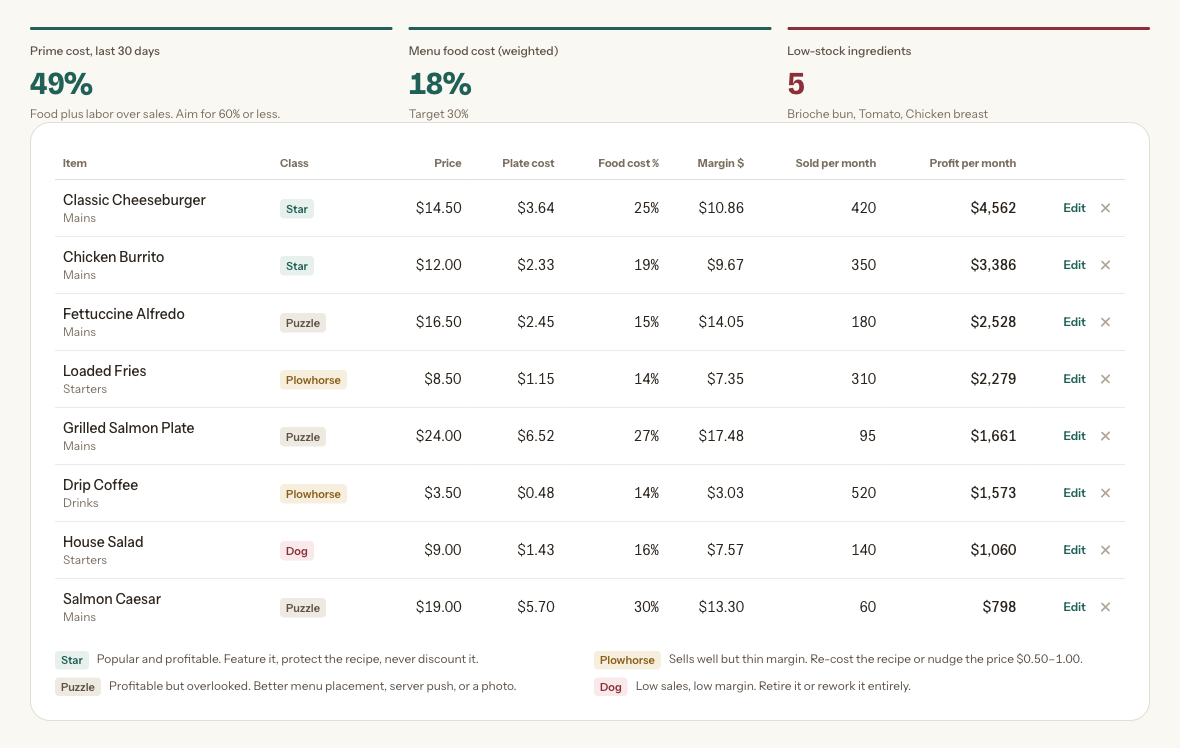
Menu engineering
Four quadrants, four different jobs.
Plotted on your own sales mix, not an industry benchmark. The demo menu below has a coffee that outsells everything and earns the least of anything on the list.
A week in the kitchen, with HDHICT open.
Monday
Enter last week
Takings and invoices in, either typed or imported as a CSV. Ten minutes.
Tuesday
Read what needs attention
The dashboard ranks it: an overdue invoice, a food-cost creep, a slipping regular.
Before ordering
Check the plates that moved
A supplier price rise reclassifies a Star as a Plowhorse before it eats a month of margin.
Before a decision
Run the scenario
New hire, price rise, extra opening day, see the monthly profit answer before committing.
Month end
Look thirteen weeks out
A quiet January shows up in November, when you can still do something about it.
The demo is a restaurant. Go and poke at it.
The demo kitchen is open to anyone: five months of trading, a real menu costed to the ingredient, and a couple of problems deliberately buried in it.
Apply for an account