The tools
Everything runs off one set of books.
You record what came in and what went out. Every screen below reads that same ledger, which is why the dashboard can never disagree with the forecast.
Open it with demo dataDashboard
One screen that answers "how are we doing" without you reading a single table. A letter grade from A to F, built from four scores that each name the figure behind them, so you can always see why it moved.
- Profit and loss for the last 30 days
- Cash on hand and what is owed to you
- An alert list computed from your own figures, not a template
- Which days of the week actually make your money
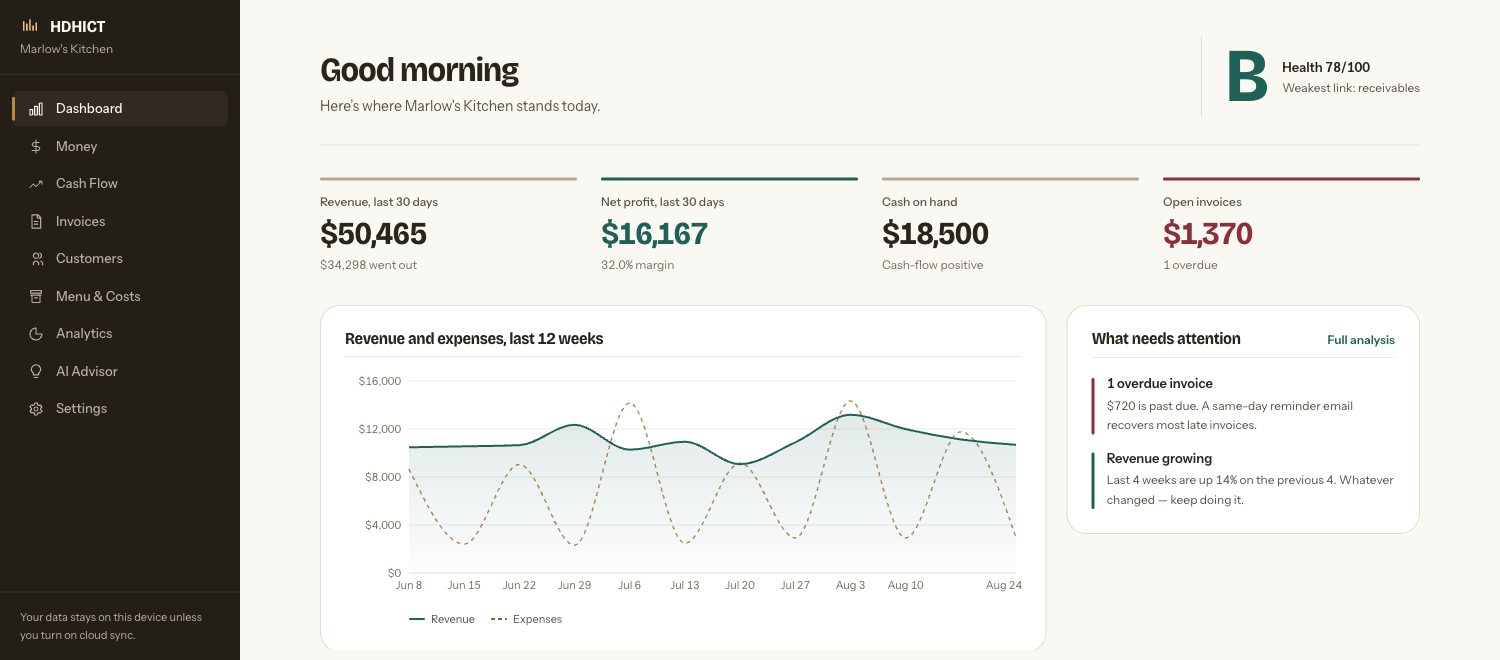
Every screenshot on this page is the real tool, filled with our demonstration restaurant. Nothing here is a mock-up.
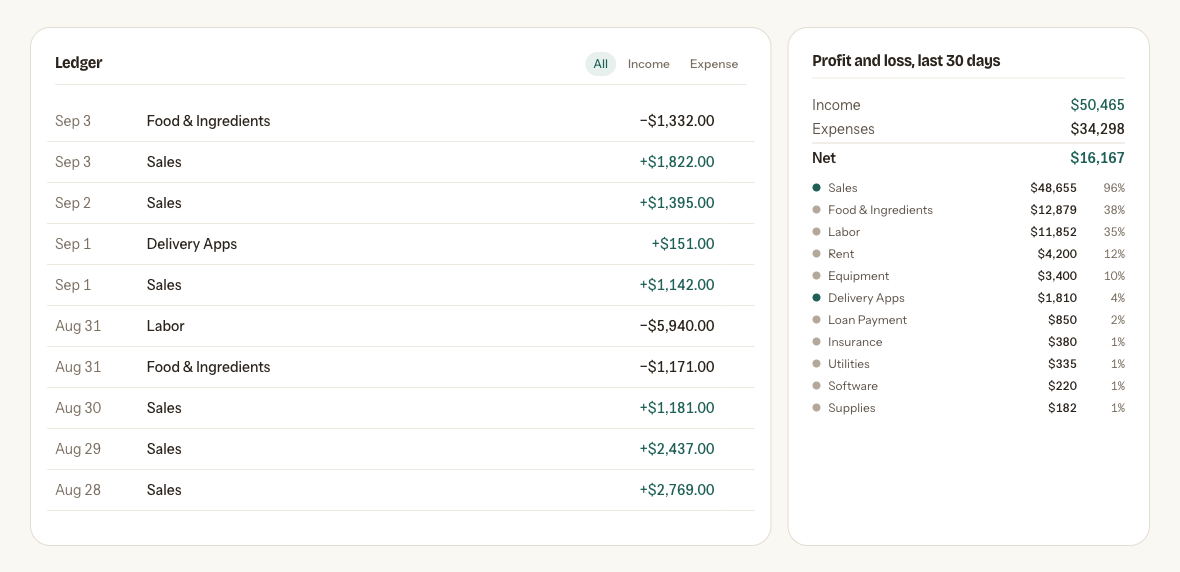
Money
The ledger everything else is built on. Type entries in as they happen, or import a CSV from your bank or your register and categorise it in one pass.
- Income and expenses with your own categories
- Recurring entries for rent, insurance and loan payments
- Profit and loss by category, for any period
- Export everything back out to CSV whenever you like
Cash flow
The tool we would keep if we could only keep one. It projects thirteen weeks ahead from your own trailing takings, then adds the bills you know are coming and the invoices you are owed, on the weeks they actually land.
If your balance is going to go under, it names the week. Nine weeks of warning is the difference between a phone call and a crisis.
See how the forecast is built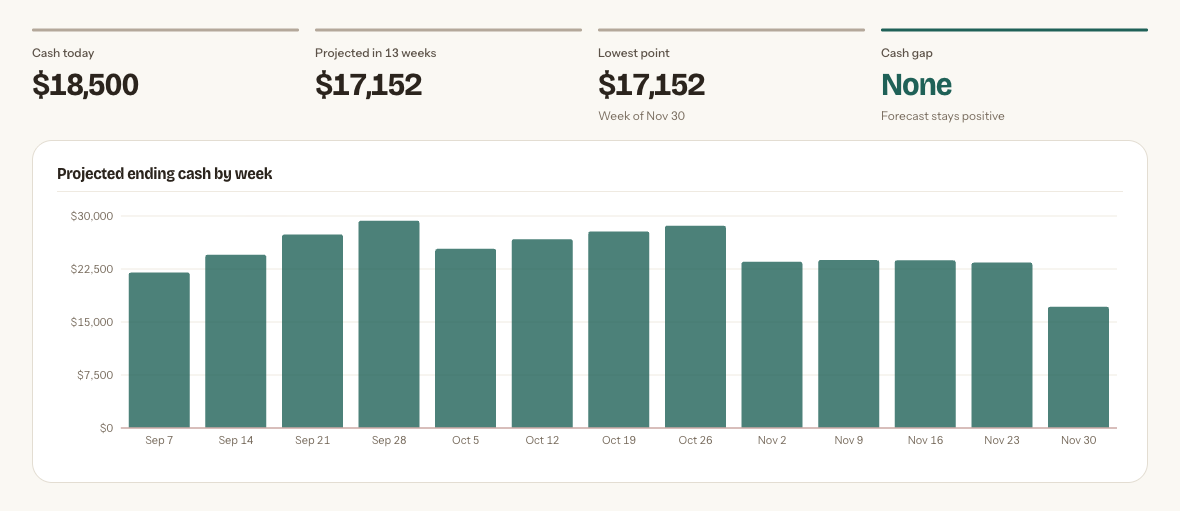
Invoices
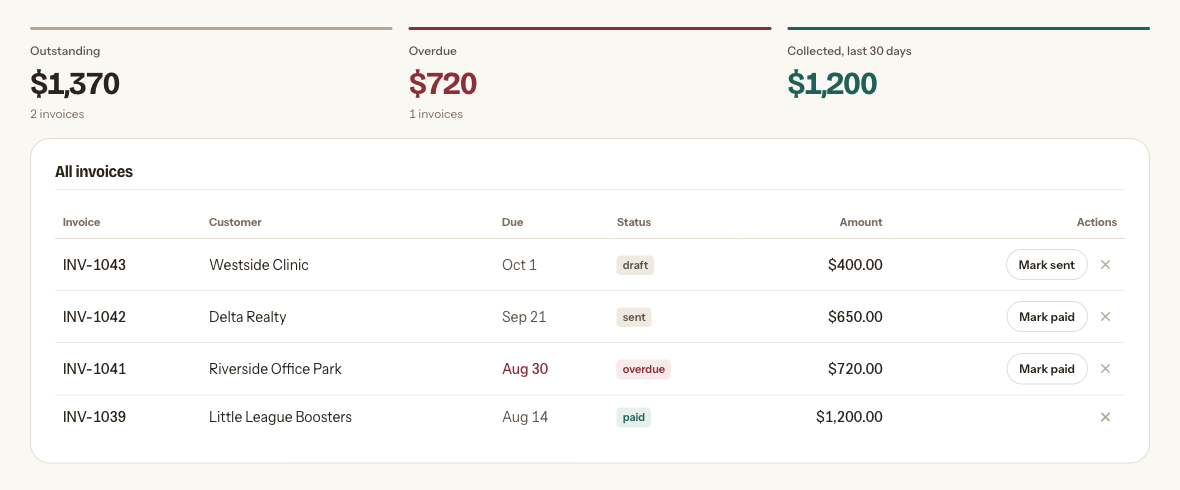
Write one, send it, and see at a glance what is overdue. Marking an invoice paid records the income in your ledger and adds it to that customer's history, so you are never typing the same number twice.
Open invoices also feed the cash forecast, dated to when the money is actually due rather than when you hoped for it.
Customers
Losing a regular is silent. Nobody tells you they have stopped coming; the takings just drift down and you blame the weather.
Every customer is scored on how recently they bought, how often, and how much, and sorted into plain-English groups — Champions, At Risk, Lost — each with what to do about it and roughly what it is worth doing.
See how the segments work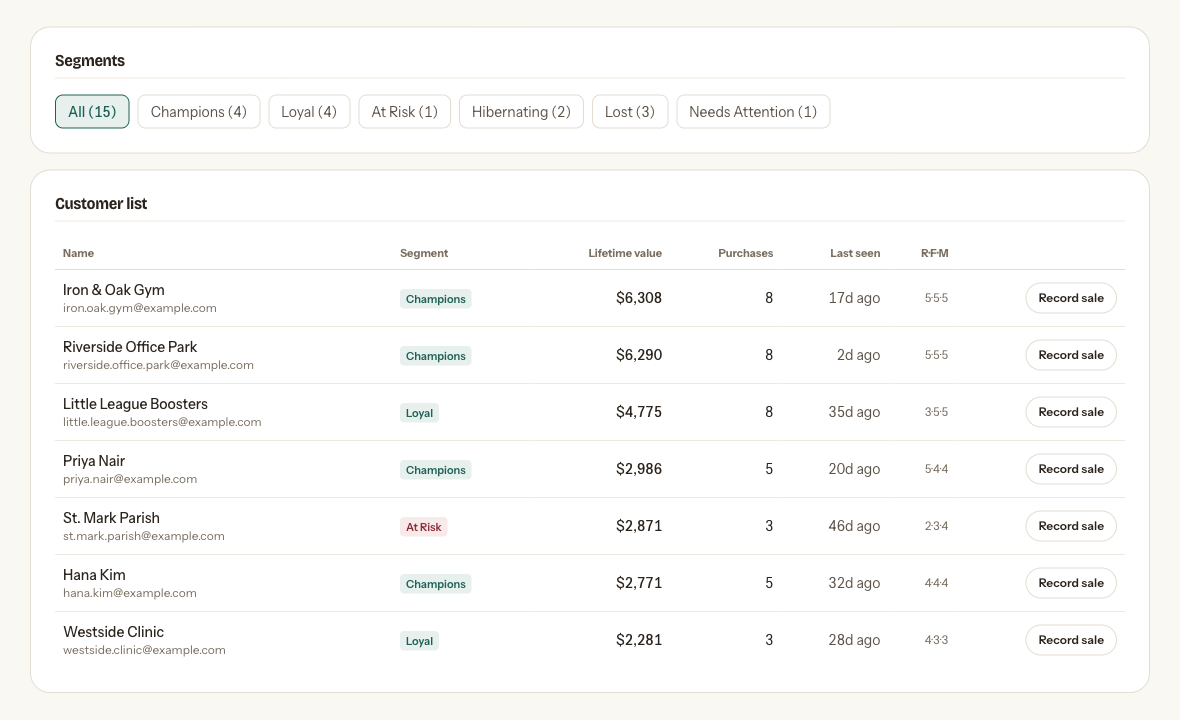
Menu and costs
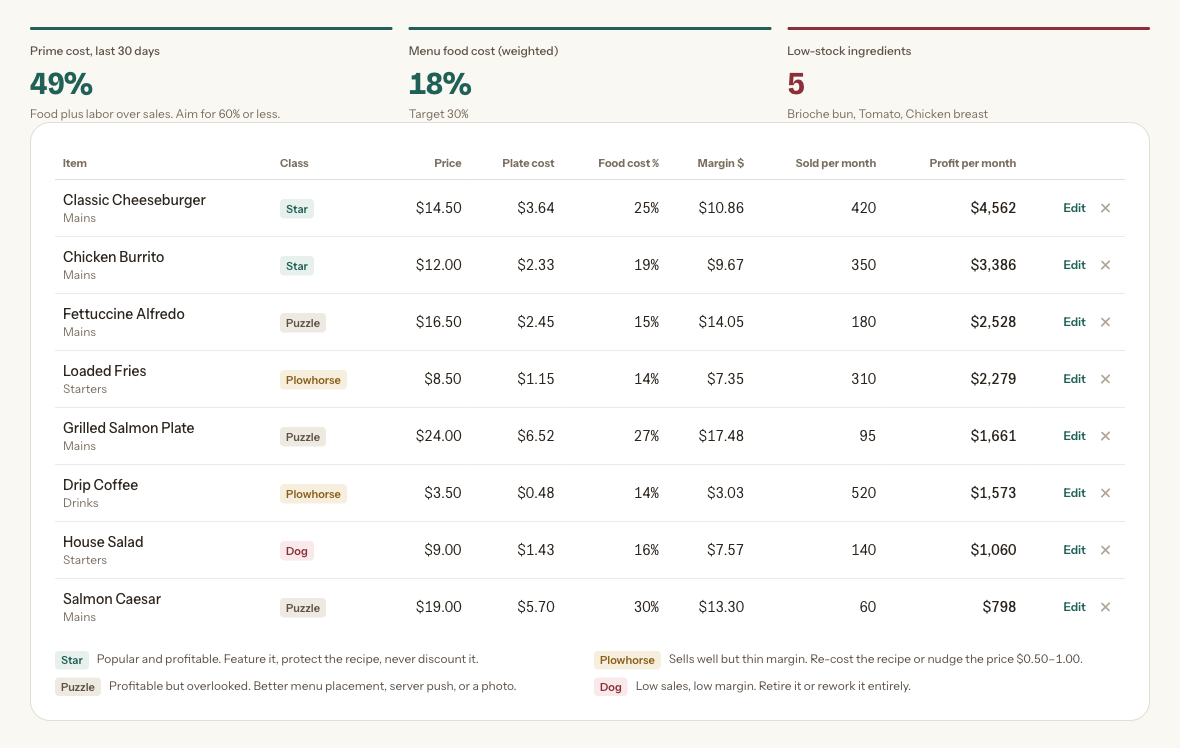
Cost out a recipe once and every plate tells you what it really earns. Items are classified against thresholds computed from your own menu, never an industry benchmark, and the ones worth repricing are the ones flagged.
- Recipe costing down to the ingredient
- Star, plowhorse, puzzle or dog for every item
- Prime cost, the number that decides whether a kitchen works
- A suggested price to hit a food-cost target you choose
- Low-stock flags on the ingredients you are about to run out of
Analytics
The questions that are hard to answer on the back of an envelope. What do we have to take just to cover the doors being open? Is that supplier charge unusual or just annoying? What happens to profit if we put every entrée up a dollar?
- Break-even sales, from your own fixed costs and margin
- Weekly trend, with how well the line actually fits your data
- Cost anomalies flagged against your own normal range
- A what-if planner for price, volume, food cost, labour and rent
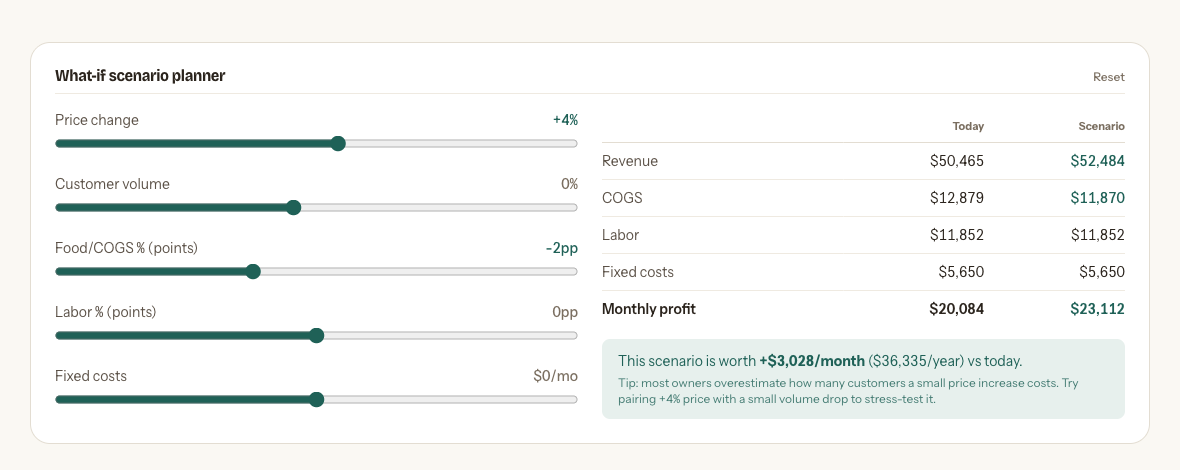
Move a slider and the whole profit and loss recomputes. The scenario is never saved over your real figures.
We started with restaurants. We did not stop there.
Kitchens got our attention first because the maths is the most unforgiving: a quarter on a plate, multiplied by four hundred covers a week, is the difference between a good year and closing.
But a salon, a barber, a boutique, a garage, a food truck and a one-person contractor all run on the same four questions — what came in, what went out, what is coming, and who is buying. Only the menu tools are specific to food, and you can simply not use them.
Look around before you talk to us.
Load the demonstration restaurant and every screen on this page fills with five months of realistic data, including a food-cost creep and an overdue invoice worth finding. No account, nothing to install.
Open the demo